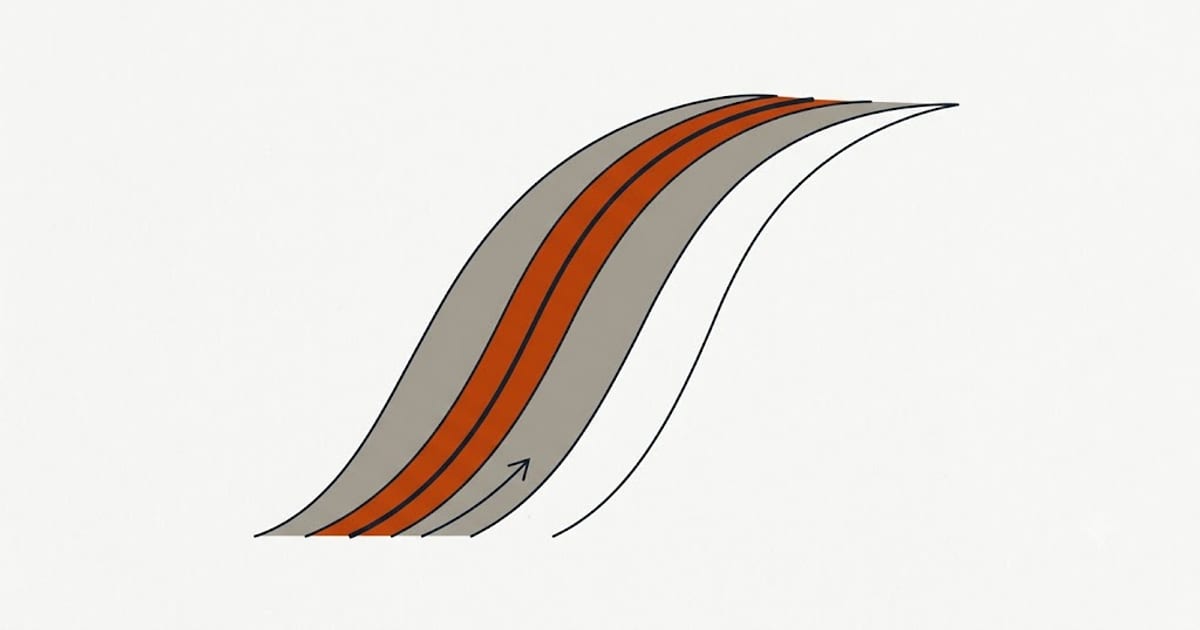
A percentile says where a baby sits among other babies of the same age and sex. The 30th percentile means 30% are smaller and 70% are larger.
It is a position, not a grade. Half of all perfectly healthy babies are below the 50th, because that is what a median is.
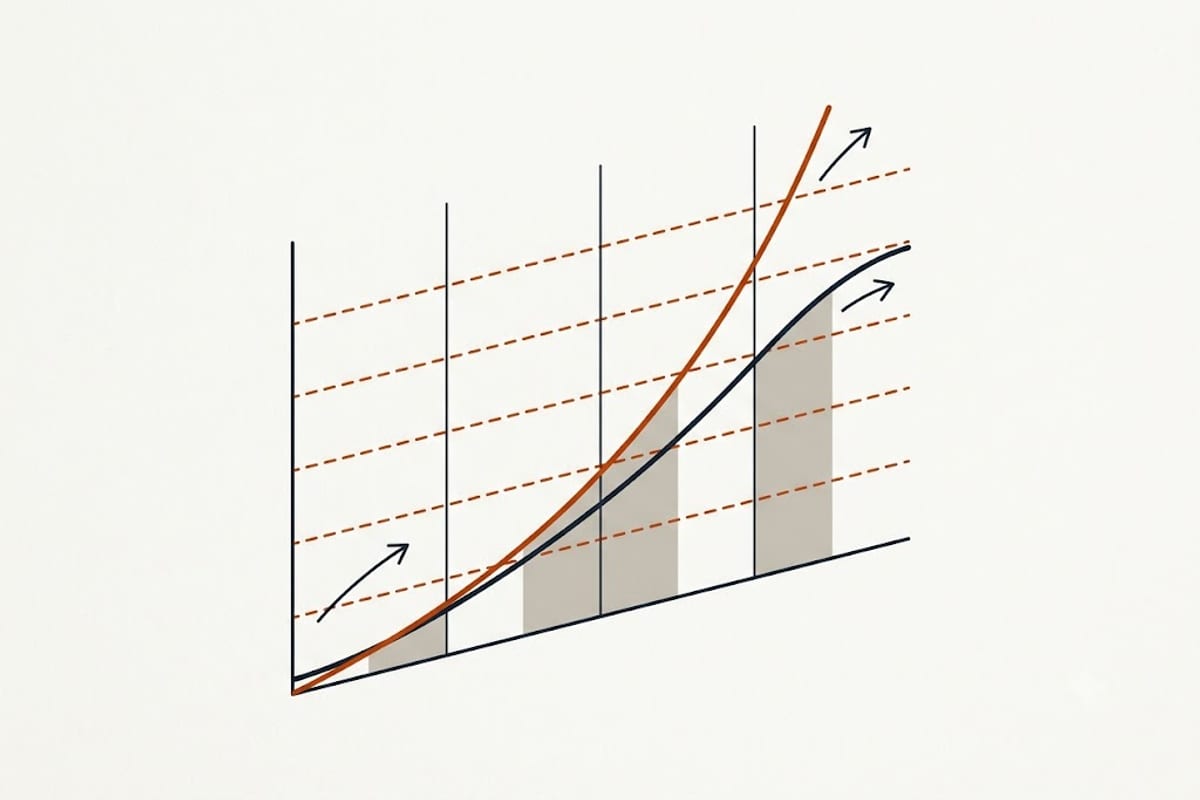
Tracking is what clinicians look at
A baby who has been on the 20th percentile since birth and stays there is growing exactly as expected. A baby who was on the 75th and is now on the 25th has crossed two major lines, and that is worth attention even though the second number is higher.
The pattern is called tracking, and following a consistent curve is the signal. The number the curve sits on is much less informative.
Normal reasons a curve moves
The first few months. Newborn size reflects the pregnancy as much as the baby's genetics. Many babies shift percentile lines in the first three to six months as they settle onto their own curve — a large baby of a small family drifting down, a small baby of a tall family drifting up. This is common and expected.
Birth weight loss. Babies lose weight in the first days and typically regain birth weight by about two weeks. Charts plotted from birth weight without accounting for this show a dip that is normal.
Different charts. Breastfed and formula-fed babies grow on slightly different trajectories, and the chart in use matters. WHO charts are based on breastfed babies; some regions use different references. Comparing a reading from one chart against another produces artefacts.
Illness. A week of poor feeding shows on the curve and recovers afterwards.
Growth spurts
Common around 2 to 3 weeks, 6 weeks, 3 months and 6 months, though the timing varies widely.
For a few days the baby feeds far more often, seems unsettled, sleeps differently, and may be harder to settle. For a breastfeeding parent this often reads as a supply problem, and it is usually the mechanism by which supply increases — more frequent feeding signals for more milk.
Spurts pass in a few days. Their main practical cost is the worry they cause.
What actually warrants a call
Crossing two or more major percentile lines downward over a sustained period.
No weight gain over several weeks, or weight loss after the first two weeks.
Fewer than six wet nappies a day on a consistent basis.
Lethargy, poor feeding, or a baby who is difficult to rouse.
Head circumference crossing lines in either direction, which is followed separately and for different reasons.
Any of these is a conversation rather than a wait-and-see.
Measuring at home
Length is difficult to measure accurately on a wriggling baby, and errors of an inch are easy — which on a chart looks like a percentile change that never happened.
Weigh on the same scale, at a similar time of day, with the same amount of clothing. Home scales vary, and comparing a home reading against a clinic reading introduces a difference that is about the scale rather than the baby.
For anything beyond casual tracking, the measurements taken at routine appointments are the ones to plot, because they are taken the same way each time.
This page describes how growth charts are generally interpreted. Your paediatrician's reading of your baby's chart takes precedence over any of it.
Preterm babies use corrected age
A baby born early is plotted against corrected age — age from the due date rather than from birth — usually until about two years. Plotting a preterm baby against chronological age makes normal growth look inadequate.
If a chart looks alarming and the baby was early, this is the first thing to check.
What percentiles do not measure
They describe size, and size is one input among many. A baby's development — rolling, sitting, babbling, responding — is tracked separately and matters more for most questions parents actually have.
A small baby who is meeting developmental milestones, feeding well and thriving is a small baby. A large baby who is not is a concern despite the reassuring number. Neither situation is visible on a weight chart alone, which is why the routine checks look at several things at once rather than one.