WHO weight-for-age, in pounds. Boys:
| Age | 3rd | 15th | 50th | 85th | 97th |
|---|---|---|---|---|---|
| Birth | 5.5 | 6.4 | 7.8 | 9.0 | 9.9 |
| 1 mo | 7.5 | 8.6 | 9.9 | 11.5 | 12.6 |
| 2 mo | 9.3 | 10.6 | 12.6 | 14.3 | 15.7 |
| 3 mo | 10.8 | 12.1 | 14.1 | 16.1 | 17.6 |
| 6 mo | 14.1 | 15.4 | 17.4 | 19.6 | 21.4 |
| 9 mo | 16.1 | 17.4 | 19.6 | 22.0 | 24.0 |
| 12 mo | 17.6 | 19.2 | 21.2 | 23.8 | 26.0 |
Girls:
| Age | 3rd | 15th | 50th | 85th | 97th |
|---|---|---|---|---|---|
| Birth | 5.3 | 6.2 | 7.5 | 8.6 | 9.5 |
| 1 mo | 6.9 | 7.9 | 9.3 | 10.8 | 11.9 |
| 2 mo | 8.4 | 9.7 | 11.3 | 13.0 | 14.3 |
| 3 mo | 9.7 | 11.0 | 12.8 | 14.8 | 16.1 |
| 6 mo | 12.8 | 14.1 | 15.9 | 18.1 | 20.1 |
| 9 mo | 14.8 | 16.1 | 18.1 | 20.7 | 22.7 |
| 12 mo | 16.3 | 17.6 | 19.8 | 22.5 | 24.7 |
What a percentile is
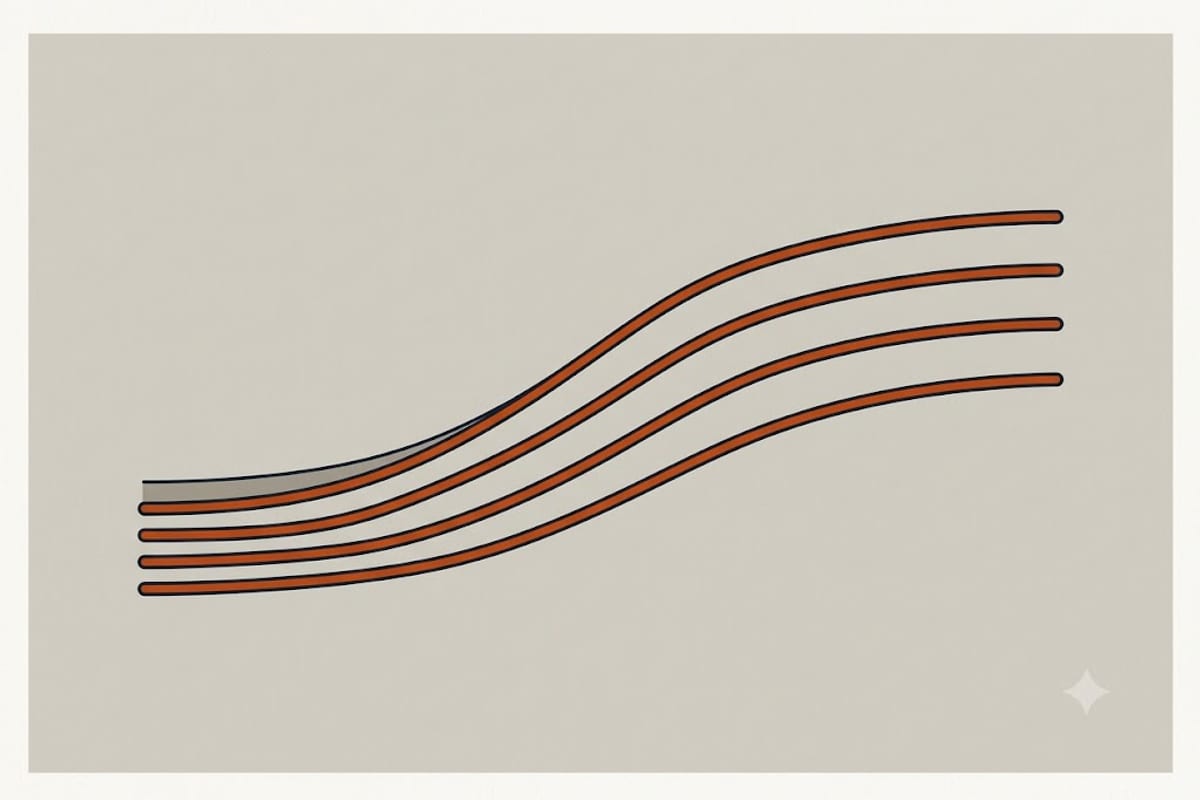
The 15th percentile means 15 out of 100 healthy babies of that age and sex weigh less. It is a position in a distribution of healthy children, not a score.
Someone has to be on the 15th. Someone has to be on the 3rd. The curve was built by measuring thousands of healthy, well-fed babies, and its whole width describes normal.
The sentence "he's only on the 15th" contains a word that does not belong there.
The direction, not the number
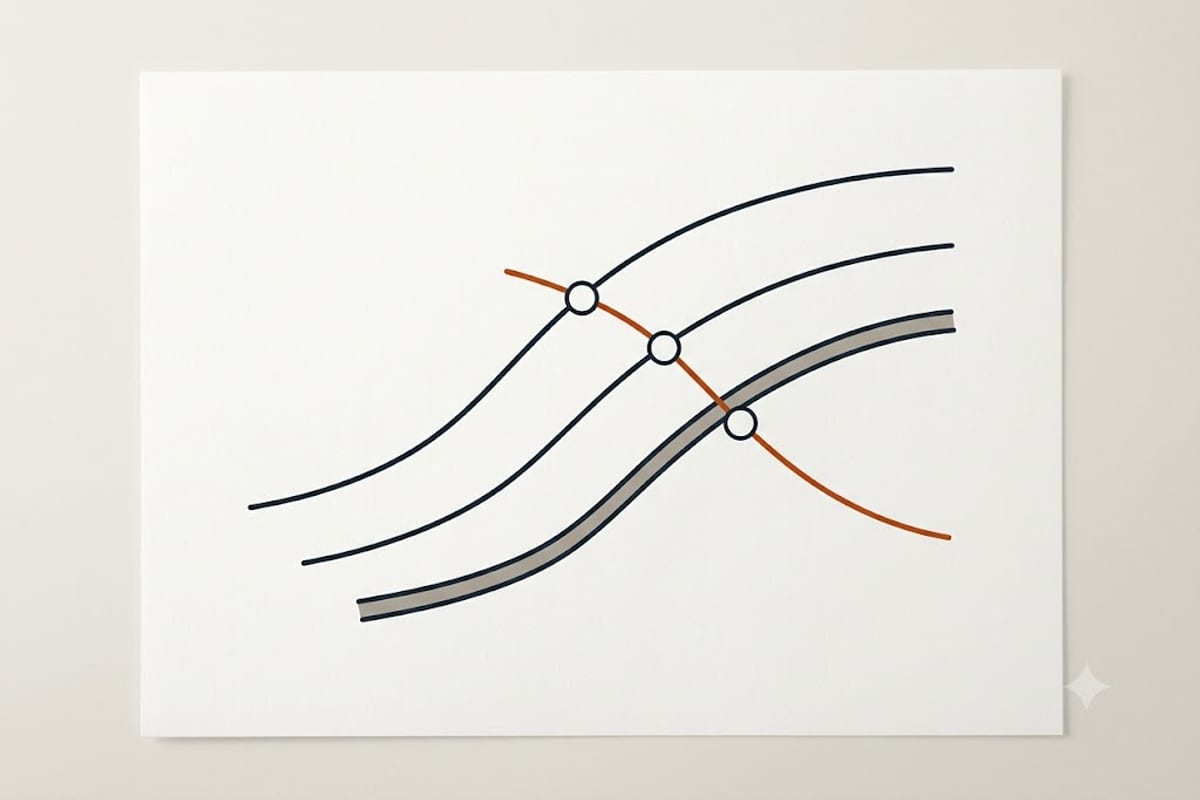
A baby tracking along the 15th from birth to a year is growing exactly as expected. A baby who was on the 75th at two months and is on the 25th at six has crossed two major lines downward — worth a conversation, even though 25th is a perfectly ordinary place to be.
Crossing one line is usually nothing, especially in the first months when babies commonly settle onto their genetic curve after a birth weight that reflected the pregnancy rather than the child.
Crossing two lines, sustained across more than one visit, is when the trend gets looked at. The same is true upward.
Boys and girls use different charts
The tables above differ by roughly half a pound at birth and more than a pound by the first birthday. Reading a girl against the boys' chart puts her about one band lower than she is, and that mistake is easy to make with a chart printed without a heading.
WHO or CDC
WHO standards (0–24 months) describe how healthy, predominantly breastfed children should grow under good conditions. CDC charts (2 years and up) describe how American children did grow in a reference population.
Breastfed babies commonly appear to drop percentiles after about three months on a CDC chart while tracking perfectly on a WHO one — which is why the CDC itself recommends WHO charts for under-twos in the United States.
If a chart at a clinic is not labelled, ask which it is before reading anything into a shift.
Weight is one of three numbers
Length-for-age and weight-for-age together give weight-for-length, which is what says whether a baby is proportionate. A baby on the 10th for both is small and proportionate; one on the 75th for length and the 10th for weight is a different picture.
Head circumference tracks brain growth and is the measurement most likely to be quietly checked and least likely to be mentioned.
Weighing at home
Same scale, same time of day, undressed, no nappy, weekly at most. Daily weights vary by several ounces with feeds and nappies, and the variation swamps the trend.
Feeding volumes sit underneath all of this — see amounts by age — and clothing follows length rather than weight.
Source: World Health Organization Child Growth Standards, weight-for-age (0–24 months).
Reference tables reproduced for general information. Any concern about your child's growth belongs with your paediatrician.