Growth Percentiles
Weight and length percentiles from WHO and CDC tables.
A percentile is a position in a distribution of healthy children. It is not a score, and the number matters far less than the direction.
The 15th percentile means 15 out of 100 healthy babies of that age and sex weigh less. Someone has to be on the 15th. Someone has to be on the 3rd. The curve was built by measuring thousands of healthy, well-fed children, and its whole width describes normal.
What paediatricians actually read
Not the number — the line.
A baby who tracks along the 15th percentile from birth to a year is growing exactly as expected. A baby who was on the 75th at two months and the 25th at six months has crossed two major lines downward, and that is worth a conversation even though 25th is an entirely ordinary percentile to be on.
Crossing one line is usually nothing, especially in the first months when babies commonly settle onto their genetic curve after a birth weight that reflected the pregnancy rather than the child. Crossing two lines in either direction, sustained across more than one visit, is the point at which the trend gets looked at.
Which chart, and why it matters
Two charts are in common use and they are not interchangeable.
WHO standards (0–24 months) describe how healthy, predominantly breastfed children should grow under good conditions — a prescriptive standard. CDC charts (2 years and up) describe how American children did grow in a reference population — a descriptive reference.
Because of that difference, breastfed babies commonly appear to "drop percentiles" after about three months on a CDC chart while tracking perfectly on a WHO one. The CDC itself recommends WHO charts for under-twos in the United States for exactly this reason. If a chart at a clinic is not labelled, it is worth asking which one it is before reading anything into a shift.
Weight alone is the least useful measurement
Three numbers are plotted, not one. Length-for-age and weight-for-age together give weight-for-length, which is what says whether a baby is proportionate. Head circumference tracks brain growth and is the measurement most likely to be quietly checked and least likely to be mentioned.
A single weight, plotted once, tells you almost nothing. That is why the chart has a line on it and not a dot.
Reference tables only. Any concern about your child's growth belongs with your paediatrician, who has the full history this site does not.
6 articles
Is 22.0 lb normal for a 17-month-old boy?
| PercentileLower quarter of the chart · CDC weight-for-age | 8th |
|---|---|
| Weight9.98 kg — the unit the chart is built in | 22 lb |
| Z-scorestandard deviations from the median | -1.42 |
| Median for this age11.62 kg — the 50th percentile | 25.6 lb |
| 5th percentile weight | 21.5 lb |
| 95th percentile weight | 30.7 lb |
| Median length at this age81.4 cm | 32.1 in |
| Median head circumference47.7 cm | 18.8 in |
Notes
- The percentile is not a score, and the middle is not a target. By definition 5% of perfectly healthy children sit below the 5th percentile and 5% above the 95th, because the chart describes a population rather than prescribing a weight. A child at the 10th percentile who has been at the 10th percentile since birth is growing normally; the same child arriving there from the 60th over three months is the situation that gets attention. Clinicians watch the curve, not the point.
- CDC recommends the WHO charts for children under 24 months, not this one. The WHO standard was built from exclusively breastfed infants under ideal conditions and describes how children should grow; the CDC chart describes how a mixed US sample did grow. In practice a breastfed baby often plots one or two bands lower on the CDC chart than on the WHO chart during the first year, which is a frequent and avoidable cause of worry. If your paediatrician's chart disagrees with this page in the first two years, that difference is very likely the reason.
- Weight only means something next to length. A baby at the 15th percentile for weight and the 15th for length is proportionate; one at the 15th for weight and the 75th for length is a different picture entirely. Weight-for-length, plotted on its own chart, is what separates them, and it is the figure a check-up actually uses.
- Corrected age matters if the baby was premature. Growth charts run from the due date, not the birth date, so for a baby born eight weeks early you plot at 17 months minus two. Doing otherwise makes a normally growing premature baby look as if it is falling behind, and correction is standard until about two years of age.
- Measuring a baby accurately is harder than it sounds. Weigh naked or in a dry nappy of known weight, on the same scale, at roughly the same time of day; a feed and a nappy together can account for half a pound. Length needs two people and a firm surface — a tape measure along a wriggling baby is routinely out by an inch, which is enough to move the percentile by twenty points.
Baby weight percentile by weight, age and sex
2,832 calculations · browse all
- Is 4.5 lb normal for a 0-month-old boy?
- Is 5.0 lb normal for a 0-month-old boy?
- Is 5.5 lb normal for a 1-month-old girl?
- Is 6.5 lb normal for a 0-month-old boy?
- Is 7.0 lb normal for a 3-month-old boy?
- Is 8.0 lb normal for a 0-month-old boy?
- Is 8.5 lb normal for a 4-month-old girl?
- Is 9.5 lb normal for a 0-month-old boy?
- Is 10.0 lb normal for a 6-month-old boy?
- Is 11.0 lb normal for a 0-month-old boy?
- Is 11.5 lb normal for a 7-month-old girl?
- Is 12.5 lb normal for a 1-month-old boy?
- Is 13.0 lb normal for a 9-month-old boy?
- Is 13.5 lb normal for a 27-month-old girl?
- Is 14.5 lb normal for a 10-month-old girl?
- Is 15.0 lb normal for a 29-month-old boy?
- Is 16.0 lb normal for a 12-month-old boy?
- Is 16.5 lb normal for a 30-month-old girl?
- Is 17.5 lb normal for a 13-month-old girl?
- Is 18.0 lb normal for a 32-month-old boy?
- Is 19.0 lb normal for a 15-month-old boy?
- Is 19.5 lb normal for a 33-month-old girl?
- Is 20.5 lb normal for a 16-month-old girl?
- Is 21.0 lb normal for a 35-month-old boy?
- Is 22.0 lb normal for a 18-month-old boy?
- Is 23.0 lb normal for a 6-month-old boy?
- Is 23.5 lb normal for a 19-month-old girl?
- Is 24.5 lb normal for a 8-month-old boy?
- Is 25.0 lb normal for a 21-month-old boy?
- Is 26.0 lb normal for a 10-month-old boy?
- Is 26.5 lb normal for a 22-month-old girl?
- Is 27.5 lb normal for a 13-month-old boy?
- Is 28.0 lb normal for a 24-month-old boy?
- Is 29.0 lb normal for a 15-month-old boy?
- Is 29.5 lb normal for a 25-month-old girl?
- Is 30.5 lb normal for a 17-month-old boy?
- Is 31.0 lb normal for a 27-month-old boy?
- Is 32.0 lb normal for a 19-month-old boy?
- Is 32.5 lb normal for a 28-month-old girl?
- Is 33.5 lb normal for a 21-month-old boy?
- Is 34.0 lb normal for a 30-month-old boy?
- Is 35.0 lb normal for a 23-month-old boy?
- Is 35.5 lb normal for a 31-month-old girl?
- Is 36.5 lb normal for a 25-month-old boy?
- Is 37.0 lb normal for a 33-month-old boy?
- Is 38.0 lb normal for a 28-month-old boy?
- Is 38.5 lb normal for a 34-month-old girl?
- Is 39.5 lb normal for a 30-month-old boy?
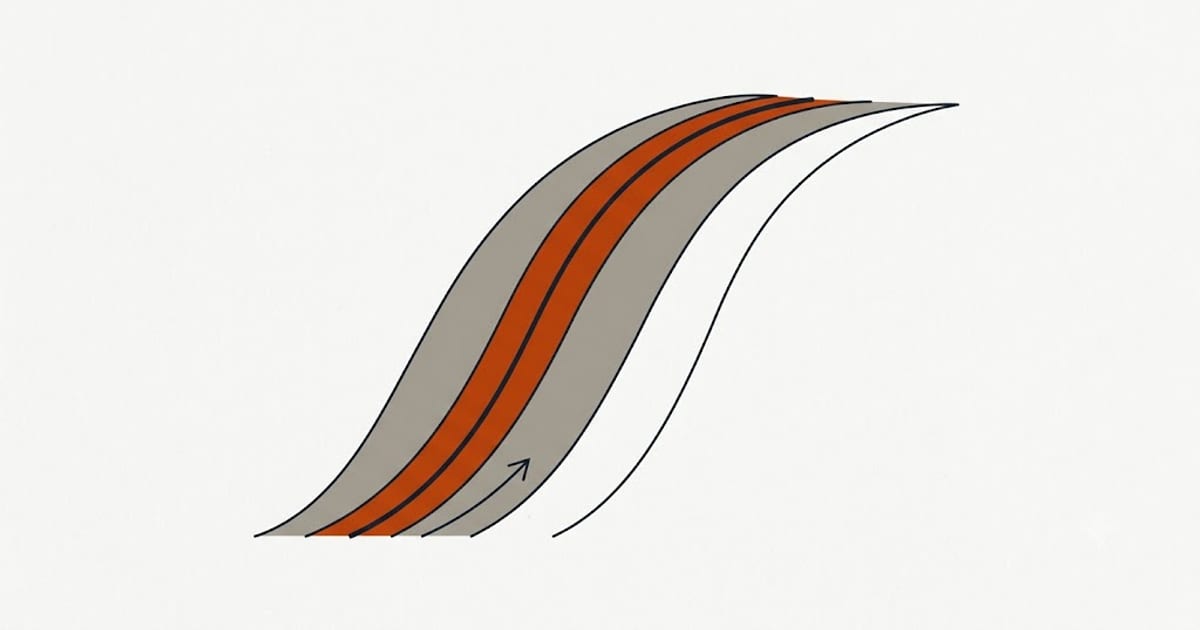 Percentiles and Spurts — The Curve Matters, the Number Does Not
Parents read the percentile as a score. It is a position in a distribution, and half of all healthy babies are below the fiftieth by definition.
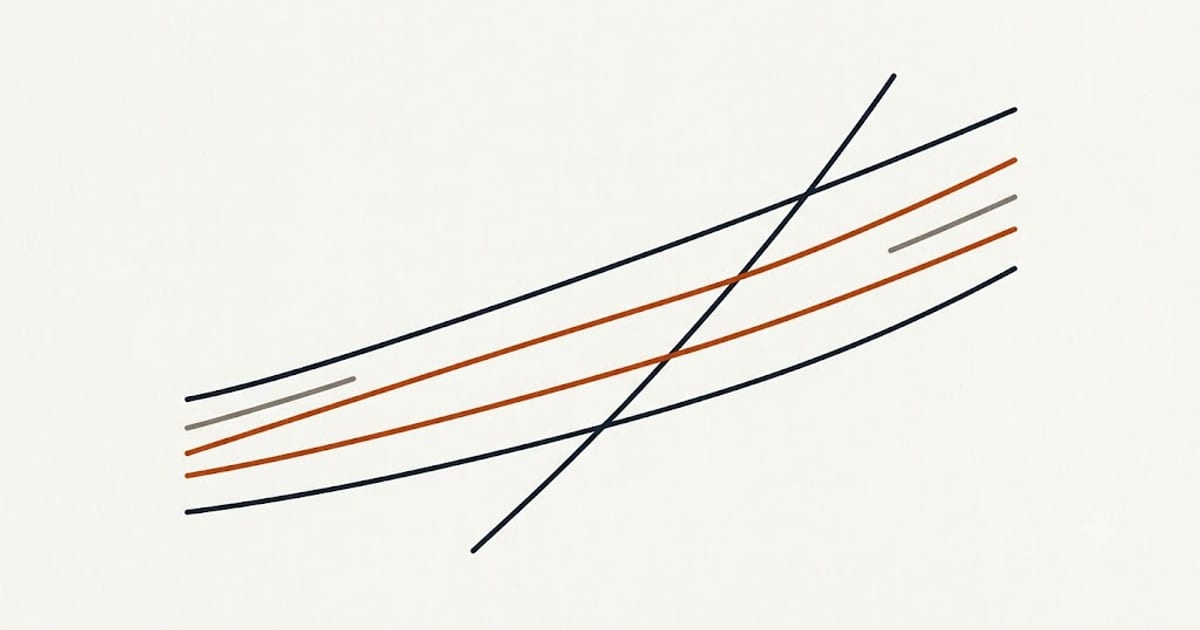 Weight Percentile for a 6-Month-Old: The WHO Table, and Why the Number Matters Less Than the Line
The 10th percentile is not a problem and the 90th is not an achievement. What a paediatrician actually reads is the direction of travel.
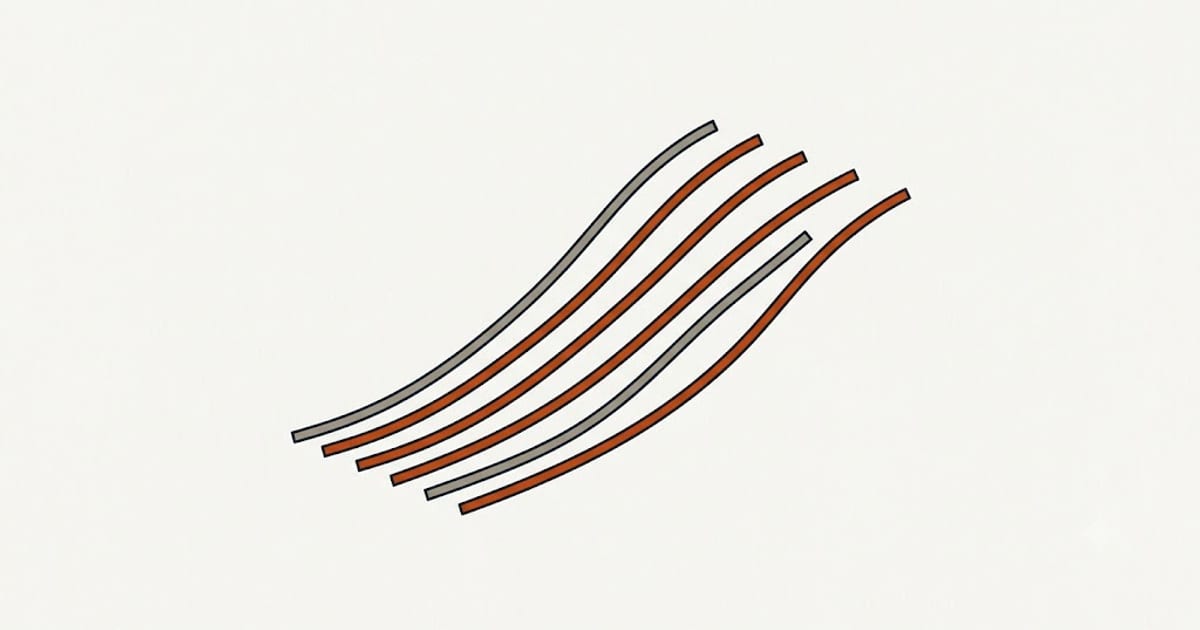 Baby Weight Percentile by Month: WHO Tables for the First Year
The full month-by-month table for the first year. The number it gives you is the least important thing on the page.
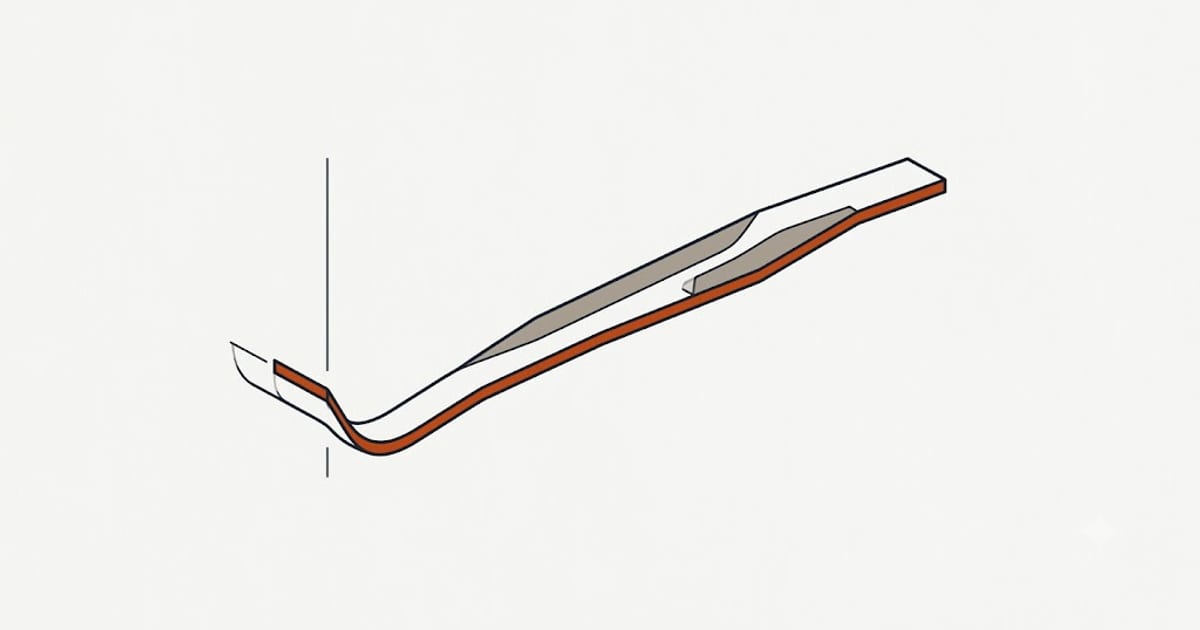 How Much Weight Should a Newborn Gain? 5–7 oz a Week After the First Fortnight
Newborns lose weight before they gain it. Up to ten percent in the first days is expected, and back to birth weight by two weeks is the milestone that matters.
 Head Circumference by Age: The Measurement Nobody Mentions
It is taken at every well-baby visit and explained at almost none of them. Head circumference tracks brain growth, and its trend line is watched more closely than weight.
 Baby Length by Age: WHO Tables, and Why It Is Measured Lying Down
Length is the hardest of the three growth measurements to take accurately, which is why it looks noisier on a chart than it really is.